## About Palanteer
### Genesis
Debugging is a major part of the software development task and is usually more time consuming than writing the code itself.
Some of the most represented ways of debugging or avoid bugs are:
- Using **assertions** to early detect abnormal states. They come with the dilemma about their quantity versus the performance impact
- Using a **debugger**, which provides a deep but time-local view of the state, where the program is currently halted
- Using **temporary `printf`**, which is very simple and flexible. It can also be efficient if the build time is low.
- Using **permanent logging** with run-time activation, and a run-time cost particularly if based on strings. Typical form of visualization is a linear dump of text lines.
For memory related investigations, some tools are working miracles: valgrind, address sanitizers, static analyzers...
However, as soon as optimization or local behavior is involved, things are getting tougher.
Same observation can be made for lock investigations in multithreaded applications.
**How can we get all the benefits of the previous methods without drawbacks?**
All started with a basic tool whose purpose was to evaluate the timing effects of some various "strategies" in a personal project.
Every part of it was trivial: basic logging interface, basic storage in a file, basic viewer loading the file and displaying only curves and text. No remote scripting.
At the same period, during one of his streamed video, the game maker Jonathan Blow demonstrated the commercial tool `Telemetry` (RAD games tools - now Epic), which seemed both powerful and simple to use.
While inspiring, maybe due to the limited demo in the video, rose a feeling that it could do much more than this great timeline, with a stronger focus on the data (the personal project needed that...).
Since then, new use cases were added in an incremental manner, the basic parts were reworked and improved, many times.
The need to test the tool itself led to the CLIs and remote scripting, which complemented ideally the observation capability.
### Confront reality
A successful tool is one which:
1. matches the needs and use cases of the users
2. fulfills its task efficiently and reliably
3. has a complexity level equal to that of the the problem it solves, not more
As `Palanteer` is a tool which aims at increasing the quality of software in general, applying `Palanteer` to itself was an obvious choice.
- Its development provided many real use cases (point 1) for instrumentation and visualization, along with some ideas of the associated user experience (point 3)
- Profiling oneself helped spotting numerous bottlenecks and improved overall efficiency (point 2 and 3)
- Developing tests for the scripting module was another use case (point 1) which helped improving reliability (point 2). The icing on the cake is that these tests are now used to detect regressions.
This self-appliance process raised many usability and quality concerns, led to many iterative reworks, and definitely changed what `Palanteer` is today.
### Usage of macros in the C++ instrumentation library
Meta-programming in pure C++ without external code generation nor macros is just in its infancy.
Indeed, getting the source filename and line number of a code line is available only from C++20 (`source_location` module), same for a really usable `constexpr` behavior required for compile-time activities.
As `Palanteer` targets C++11 for broader audience and requires compile time computations, building an user interface for simple code instrumentation leads to a very narrow choice: the "infamous" macros, or nothing.
So macros are used, there is no alternative for our practical use case...
For some APIs, variadic templates could have replaced the macros if the `constexpr` argument discrimination was a thing in C++. But it is not the case even now, maybe in C++23?
Variadic templates are used only in places where it brings something, namely enhanced assertions, also in conjunction with macros to stringify the variable names...
One of the weaknesses of the tool is the cryptic preprocessor bunch of errors when the API is misused.
This weakness would however still be present and at an equivalent level (but with cryptic C++ compiler errors this time, no pre-processor), if templates were used intensively. At the same time, the compilation time would degrade so much that it would probably be a "no-go" for many people.
### No smart pointer
Manipulating memory shall be done with care and control, especially with current CPUs where memory access is the performance bottleneck.
Wild usage of smart pointers can be dangerous:
- it makes us lazy when thinking about memory
- Control of where we allocate and deallocate shall not be fuzzy but deterministic
- Overallocating has a performance cost
- it is an abstraction which masks the hardware reality. Processors work with raw pointers.
- smart pointers can also be misused
- address sanitizers are very efficient against memory leaks, among other things
### No STL container
This project does not use STL containers by choice. It uses some STL algorithm, though (mainly sorting).
Some reasons behind are:
- debug code is extremely slow with the containers of the standard library. This is due to its heavily nested coding style and absence of inlining in debug mode
- simple code is often better, at least for compilation time and full control
- some containers have knowingly bad performances because they target standard compliance and genericity. Also because C++ ABI must stay stable.
- Ex: `unordered_map` implementation is structured around an array of list which is not cache efficient and allocates frequently
- it is always fun and interesting to develop one's own containers (at least once)
An implementation of (`Palanteer` specific, not generic...) vector, list and dense hashmap are proposed in the `./server/base` folder (MIT license).
!!! warning Important
These implementations match the need of the `Palanteer` project. They are not a generic replacement of the standard library.
If you want to use them in a project, please read carefully the limitations on top of the files and do not hesitate to modify them to fit your needs.
### Dynamic event selection
The provided event selection scheme is at compilation time via the groups or the global `PL_NOEVENT` switch.
It is a "compile-time event selection".
Some projects may need a "dynamic event selection", i.e. embed all or a part of them at compile time, and select at run time which one to activate.
In this case, the code is always included and an additional test is done at run-time to check if the event shall be generated or not.
This scheme is not included inside `Palanteer` for several reasons:
* there are many ways to implement it
* it shall be used carefully so that the hierarchical tree is not corrupted if the tracing is enabled "in the middle" of a run
* theoretically, tracing shall be enabled when each thread is at the root of the tracing tree. Else some "end" scope will not have any corresponding "begin" event.
A dynamic selection provides more flexibility but decreases performances (due to the additional test and instruction cache effects).
Note also that compile time and dynamic selection can be combined.
!!! warning
A general recommendation is to be careful with the friction induced by the wrapped instrumentation API.
Indeed, it is tempting to add a dynamic "topic" field, an importance level, etc...
If all these fields shall be provided by the developer at each event tracing, the underneath side-effect is that the instrumentation quality may degrade.
The proposals below are just some non-exhaustive examples.
**Proposal 1: global enumeration and generic wrapper**
Example of identification of the dynamic groups with a global enumeration and a global variable for the filtering level.
The user interface is based on a generic macro wrapper, which is simple and works in all cases but is less readable:
~~~~~~~~~~~~~~~~~~~~~~~~~~~~~~~~~~~ c++
// Dynamic tracing context
enum DynGroup { DEBUG, DETAIL, INFO, CRITICAL };
DynGroup globalFilteringLevel = INFO; // Events below this level are not generated. This variable is controlled externally
// Dynamic filtering generic macro
#define WRAP(level, cmd) if(level>=globalFilteringLevel) { cmd; }
// Usage:
// ======
#define PL_GROUP_FRUIT 1
WRAP(INFO, plData("My fruit", "banana"));
WRAP(DEBUG, plgVar(FRUIT, a, i, tmpVar)); // PL_GROUP_FRUIT must be set to 0 or 1 beforehand
~~~~~~~~~~~~~~~~~~~~~~~~~~~~~~~~~~~
**Proposal 2: opaque handler based dynamic selection and dedicated wrappers**
Example of identification of the dynamic groups with an "opaque tracer" structure whose state is controlled externally.
The user interface is based on a dedicated wrapper which is more readable than the generic wrapper but requires wrapping each of the ~40 `Palanteer` API independently.
For variadic macros (with variable number of argument) like `plVar`, it involves entering a bit more in the marvelous world of the preprocessor.
~~~~~~~~~~~~~~~~~~~~~~~~~~~~~~~~~~~ c++
// Opaque (for the user) tracer structure
struct DynTracer {
const char* name; // Could be an enum, or a number. Any kind of identifier
bool isEnabled;
};
// Dynamic tracing context
constexpr int MAX_TRACER_QTY = 128;
DynTracer globalTracerArray[MAX_TRACER_QTY]; // Be careful with reallocations if you use a std::vector
int globalTracerQty = 0;
std::mutex tracerMutex;
// Create an instance of a tracer that can be activated dynamically
DynTracer*
createTracer(const char* name)
{
std::lock_guard<std::mutex> guard(tracerMutex);
plAssert(globalTracerQty<MAX_TRACER_QTY);
globalTracerArray[globalTracerQty] = { name, false }; // C++14 at least
return &globalTracerArray[globalTracerQty++];
}
// Set the active state of a tracer
bool
setTracerEnable(const char* name, bool state)
{
std::lock_guard<std::mutex> guard(tracerMutex);
for(int i=0; i<globalTracerQty; ++i) { // Indeed, this simple example is not optimal
if(strcmp(globalTracerArray[i].name, name)!=0) continue;
globalTracerArray[i].isEnabled = state;
return true;
}
return false;
}
// Dynamic filtering dedicated wrappers
#define myData(logh, name, value) if(logh && logh->isEnabled) plData(name, value)
#define mygData(logh, group, name, value) if(logh && logh->isEnabled) plgData(group, name, value)
#define myVar(logh,...) if(logh && logh->isEnabled) plVar(__VA_ARGS__)
#define mygVar(logh, group,...) if(logh && logh->isEnabled) plgVar(group, __VA_ARGS__)
...
// Usage:
// ======
#define PL_GROUP_FRUIT 1
// Create the tracer for a particular topic
DynTracer* logBio = createTracer("Fruits and vegetables");
// Set its state
setTracerEnable("Fruits and vegetables", true);
// Log events for this topic by passing the topic tracer which contains the dynamic enable state "isEnabled"
mygData(logBio, FRUIT, "My fruit", "banana"); // PL_GROUP_FRUIT must be set to 0 or 1 beforehand
myVar (logBio, a, i, tmpVar);
~~~~~~~~~~~~~~~~~~~~~~~~~~~~~~~~~~~
!!! error Important
The easiest way to avoid hierarchical tree corruption is to set the tracing state dynamically but before any event tracing.
If it needs to be changed at any moment, you have to ensure that the tracing state change is applied at the root of the tree for the concerned threads, else the tree structure will be corrupted.
### Supported languages
Two instrumentation libraries currently exist:
- for C++11 and above
- for CPython 3.7 and above
Some more languages may be added later.
The instrumentation API strongly depends on the programming language.
Indeed, some of them have metaprogramming facilities, some others have no need for enhanced assertions, some others do not have RAII/defer/cleanup making automatic scope closing problematic, etc...
Brief and partial thoughts:
* Python
* The profiling hooks in CPython made possible a good level of automatic instrumentation, which is in phase with the "easy coding" principle of the language.
* Wrapping the C++ instrumentation inside a Python C extension module made the port straightforward.
* The instrumentation API in Python is very simple compared to the C++ one (no static strings, no groups, no compile-time configuration...)
* Less control on the hardware also means less responsibilities...
* C++
* C++11 is the minimum supported version as older releases miss many useful features (mainly platform-uniform support, atomic functions, variadic templates for enhanced assertions)
* Older C++ support is possible but would require more platform specific work (multithreading, atomic, non-standard thread_local...) and a reduction of the feature list (no enhanced assertions).
* C
* Like C++ releases before C++11, C11 support is possible but would require more platform specific work (multithreading) and a reduction of the feature list (no enhanced assertions, no automatic scope closing)
* atomic were introduced in C11, so OK
* Automatic scope closing lacks RAII, or any defer mechanism (`cleanup` is a GCC 4.0+ and recent CLANG extension, so not official)
* Other languages
* Each language is unique, so is its potential API and set of features, on top of the fundamental event logging
* In C++, the design and additional feature set was directly inherited from the language's constraints. In some other languages, they would not exist at all.
* Ex: the stack trace display, the variants between static and dynamic string APIs, the usage of macros leading to a cascade of confusing errors...
### Note about "other" features
`Palanteer` does not aim at implementing all possible features for software quality improvement.
It rather focuses on making easily accessible observations on the dynamic program execution, which is not well covered nowadays in free software (author's opinion).
Many existing tools are already filling some gaps and do it well. Trying to compete or duplicate them would be a waste of time and energy.
Therefore the following features **are not** considered in `Palanteer`:
- **Detecting memory leaks**
`Palanteer` shows memory leaks but with false positives as it does not cover the very start and very end of the life of your program.
Address sanitizers (ASAN) are dedicated to memory issues and can do much more than just leaks detection.
Use ASAN whenever possible or make it the default option for debug builds (warning: it may interfere with some debugger...)
- **Sample based profiling**
This kind of profiling method is definitely the more accessible as it works with any existing program containing debug information.
However, its precision depends on the chosen sampling rate and the duration of the profiling snapshot: its reliability may be weak on short runs or rarely covered but important code. This is even more visible on the nonetheless impressive "cost per source code line" feature.
`Palanteer` chooses instrumentation-based profiling to ensure reliable data and fine precision (~20 ns on current x64) in all cases, indeed at the cost of the instrumentation. And for this price, the benefits of the event tracing is much larger than just getting some timings.
- **Advanced CPU profiling**
Hardware events of CPU chipsets are obviously better managed by their respective CPU vendors who already propose their own tool.
Non-exhaustive list: *Intel VTune Amplifier, AMD uProf (formerly CodeAnalyst), Arm MAP*...
Cache misses, branch misprediction, optimal port usage... are advanced profiling and not in the scope of `Palanteer` which targets higher level CPU profiling.
- **GPU Profiling**
Modern GPUs are accessible through different APIs (*Vulkan, OpenGL, DirectX, Metal...*) and can also provide chipset specific statistics.
Dedicated profiling and analysis tools exploiting this information already exist for many couple (chipset, API).
Non-exhaustive list: *RenderDoc (open source), NVidia Nsight, Radeon GPU Profiler, Intel GPA*...
The argument for not adding such feature is very similar to the one of the advanced CPU profiling: vendor or dedicated GPU profiler are already covering the topic in a deep way.
- **Code disassembly**
This kind of view, depending on chipsets, is required only in very specific conditions and many tools are already available.
Non-exhaustive list: *any debugger, objdump, compiler explorer (https://godbolt.org )*...
For code optimization, the strategy here is to detect hot spots with `Palanteer` and, only if required, disassemble and investigate with an available external tool.
## Adding a new platform for instrumentation
The instrumentation library currently has full support for the following OS:
* Linux (Debian, Ubuntu...), 32 and 64 bits
* Windows 10 (always 64 bits)
The event tracing mechanism is OS independent but many side features are not. This explains why additional work may be required for any other operating systems.
Ideally, porting on a new platform/OS shall be possible without any `Palanteer` code modification, just by adding some OS dedicated code.
This task has been prepared to be that way, but without any guarantee (it really depends on the OS constraints).
The planned mechanism is the inclusion of the `palanteer.h` header inside another one, say `ported_palanteer.h`, preceded by some additional functions and configuration.
The list of "porting points" are:
1. Getter of high resolution timer
* Override the macro `PL_GET_CLOCK_TICK_FUNC` to point on the new clock getter.
* The returned value shall be monotonic (no wrap), the frequency will be measured/calibrated at program startup time.
The C++ function from `<chrono>` is a possibility.
The main constraint comes from the compatibility of this clock with the one for the context switches collection (if any).
1. Getter of the current system thread unique identifier
* Override the macro `PL_GET_SYS_THREAD_ID` to point on the new current thread ID getter.
* The main constraint comes from the compatibility of this thread ID getter with the ones processed in the context switches collection (if any), as they shall match.
1. Program exit
* Override the macro `PL_IMPL_CRASH_EXIT_FUNC` to point on the new program exit function.
* The default and standard C++ `quick_exit(1)` value should work for most system, except maybe the embedded ones.
1. Communication channels
* The standard communication is done through sockets (POSIX or Windows) or written in a file, via 4 functions (init, uninit, send, receive)
* If `PL_IMPL_CUSTOM_COM_LAYER==1`, the following functions shall be redefined externally, after the `palanteer.h` include to be able to access the internal implementation state:
~~~~~~~~~~~~~~~~~~~~~~~~~~~~~~~~~~~ c++
// Initialization of the communication channels. 'doWaitForServerConnection' specifies if the connection to server is blocking or not
static void palComInit(bool doWaitForServerConnection);
// Uninitialization of the communication channels.
static void palComUninit(void);
// Sending a buffer to the server. Returns the execution status
static bool palComSend(uint8_t* buffer, int size);
// Receiving data from the server. Returns the received byte quantity
// A value 0 means a disconnection from the server. A value -1 means an empty reception after the timeout
static int palComReceive(uint8_t* buffer, int maxBuffersize);
~~~~~~~~~~~~~~~~~~~~~~~~~~~~~~~~~~~
They shall manage both modes `connected` and `file storage`, the mode is accessible in the implementation state.
1. Optional: Context switches
* These events are also very dependent on the OS. Porting implies coding fully the collection function, with the Linux or Windows code (which contains comments) as main documentation.
* The internal function to log context switch events is `plPriv::eventLogCSwitch(...)`, see the Windows implementation as an example.
* The clock **must** have the same source (origin & frequency) than the function in `PL_GET_CLOCK_TICK_FUNC`.
- Note: The Windows API provides context switches with limited precision timestamps compared to the event clock.
- A conversion mechanism has been implemented for this particular case, based on an initial calibration to adjust the frequency and periodic offset adjustments.
1. Optional: Signal and/or OS exception handling
* These features are very dependent on the system.
* A call to `plCrash` shall be inserted in these OS handlers so that the stacktrace can be handled and the last events flushed to the server.
1. Optional: Stack trace collection
* Override the macro `PL_IMPL_STACKTRACE_FUNC` to point on the new stack trace collection function.
* Each stack trace line shall be logged with `plData` as a dynamic string inside a scope declared with `plScope("CRASH Stacktrace")`
* The scope name is arbitrary and allows common tools to understand the semantic
!!! note
The default memory allocation tracking is done by overloading the `new` and `delete` operators, which should match most platforms with C++11 capabilities.
It can be replaced by using the internal functions `plPriv::eventLogAlloc` and `plPriv::eventLogDealloc`, see the `Palanteer` implementation as an example.
!!! tip
Porting on a new platform requires at least some basic understanding of the `Palanteer` code for the currently supported OSes.
However, even if advanced, the task is not that complex once the points above are mastered for the target OS.
## Thoughts on software quality
### Development advice
This section is an unordered collection of "pieces of advice", mostly common sense, for software developers.
- **Never ever ignore "weird" observed behaviors**
- Investigate them ASAP, or at least note them somewhere for early investigation.
- They usually reveal bugs or a bad designs.
- Keep in mind that reproducing a bug is sometimes hard, so if you currently have an easy way to reproduce it, go and clarify/fix it!
- The cost of ignoring odd things grows fast when sources of weirdness adds up or when bug reproduction rate is low, especially when the software is already in the hands of some customers.
- **Keep build time small**, as it is part of the development cycle
- Development efficiency is directly linked to it.
- **Think as if you were the user of the software**
- All over complicated, under-explained or bizarre usage shall be reconsidered.
- An unhappy user or a user which does not understand how the program works, costs time and money.
- Documentation is only a part of it, as for instance a good API is one which is easy to understand at first read and which does not give the freedom of misusing it.
- **Reduce your external dependencies to the minimum required**
- Dependencies introduce hazard and reduce control (run time, build time, build constraints, overall complexity...), so their added value shall really be worth it.
- **Use asserts**
- They greatly speed up the bug investigation by crashing "nicely" close to the inconsistency.
- Their impact on performance is usually low because data is already in the cache/registers so a test is ~1 CPU cycle.
- Also, if `Palanteer` is used, groups of asserts can be enabled on demand at compile-time
- Keep the condition as a simple check, never perform actions inside an assertion as it may be disabled at compile time.
- Never assert on external inputs, as they are not under control.
- **For time related constant/variable, always include the unit in the name (example: `timeout_msec`)**
- Such bugs due to confusion on units are so frequent and so easy to avoid...
- Mistake on time units are the more representative, but this hint is applicable to all units as soon as there may be some ambiguity
- **Use address sanitizers (ASAN)** whenever possible
- It is builtin in `gcc` and `clang`, enabled with a few compilation/linking flags
- The reported issues (uninitialized memory read, leaks...) would be very hard to track without such class of tool.
- The performance of the Address Sanitizers is often around half of the one of the debug mode, so much more acceptable than the 10x slowdown of `valgrind` (which is a fantastic tool anyway).
- If possible, tests shall be performed with ASAN builds in order to maximize the observation spectrum.
- Consider also the other sanitizer tools (threads, undefined behaviors, ...)
- **Remember that software always contain bugs** (just try to prove the opposite...)
- Also, any change can create a regression.
- Eventually, what matter is simply that all target use-cases are covered by tests before each delivery.
- Ideally, tests shall be executed quickly and be easy to launch (because humans do not like to wait).
- Do not mix testing features (should be executed quickly and if possible at each commit) with stress tests (longer by nature, less deterministic. For instance to run each night).
- **Software evolves, and matures with time and work**
- Feedback from users or testers are critical to the maturation of the software. No feedback, no correct evolution.
- You do not need big surveys. Feedback from ~5 people are enough to get the big lines and filter out the outlier feedback.
- Initial implementations usually have only one value: they "just work"
- They are suboptimal in many ways, as the discovery of the topic and the code writing are done in parallel
- Now that the global view is available, a second pass on the code is highly beneficial: simplification, optimization and better maintenance
- To keep a software under control, regular maintenance (=partial rewrite and simplification) is required, especially when objectives are changing
- During an evolution, simplifying or clarifying a larger section of the code shall be considered
- It is an additional risk at short term, but it reduces technical debt at middle term.
- Moreover, some thorough tests on the topic will be performed anyway, why not maximizing their effect?
- The safety net when rewriting or modifying some code are the tests. Just have some tests.
- "Not tested, not working"
- Without tests, you are blind, no observation or measure of quality is possible (whatever its absolute value)
- the code is not under control and each evolution jeopardizes deliveries.
- lack of observation of the software is directly linked to bad quality
- A side effect of the lack of tests is the fear of change. This leads to reduced maintenance (which is then a risk) and fossilized software.
- **When testing, distinguish reliable detection of a failure (something is wrong for sure, but we do not know where) from reliable code-localisation of the issues**
- The first corresponds to high level tests
- usually some user test cases
- they stimulate a large spectrum of functionalities to make the expected global behavior
- they are like a "checksum" of the behaviors of the sub components of the system
- The second corresponds to unit tests or integration tests (or any partial system stimulation)
- more of them are required for a good coverage
- they are more appreciated by developers because closer to the software architecture and implementation
- beware to keep them far enough from the implementation so that their maintenance cost is kept low in case of code rewrite
- Both kinds are important, their nature and "angle of attack" are just different. Several blades are better than one...
- **About unit-tests vs system tests vs integration tests vs functional tests vs end-to-end tests, etc...**
- As biologist classify the living organisms, some people classify the tests within boxes, with semantic or philosophical concerns.
- It is better to focus on the characteristics of the system under test rather than on the nature of the tests to apply on it.
Imagine a multi-dimensional space and place a system or subsystem on these axis (definitely a non-exaustive list) to get an idea of the tests to create:
- the variability of its behavior in time. For instance, a hashtable is not likely to vary much.
- tests too close to the implementation may be a burden to maintain for quickly evolving systems.
- the dependencies of the system
- Dependencies can prevent proper testing, and stubbing them may distort the result of the test. Dilemma...
- the complexity of the behavior of the system
- Complex behaviors imply a choice: higher test quantity or higher level tests
- Complex behaviors should have pyramidal testing: high level tests an some lower level tests on its sub components, recursively
- the criticality of the system.
- A fundamental component shall be tested with more care, as any issue may propagate in upper layers
- Investigating an issue visible at a given level and whose root cause is at a lower level, is usually very costly as all upper layer hypothesis are considered first.
- ...
- In this test jungle, the key idea is to **maximize the probability to find a bug during a finite given time slice**
- The "bouquet" of tests shall be designed with this goal in mind. If a large time slice is available, good for you.
- Potential bugs to search shall be weighted in relation to the impact on the business
- As **only the bugs impacting the customers matter**, the collection of the real customer usage scenario is critical to create an efficient testing coverage.
- Of course, to create a great product, the working environment shall also be "bug-free" and efficient. These kind of bugs impact indirectly the customers through the quality of the product.
### A way to manage TODOs
Source code is often written iteratively, from coarse lines to fine details, and rarely in a linear and exhaustive manner.
Many limitations or problems are voluntarily ignored during the code writing. They are put aside for later, so that
* The developer is not blocked working on details while the big structure is still unclear. Also a change in the big structure is likely to void current work.
* The mental load does not saturate
And it happens that later, when this "local context" is flushed out of the mind, some of these ideas, limitations or important questions are forgotten, especially when the code size grows.
Listing your future tasks and ideas inside a 'TODO list' file is obvious. Simplicity is often the best choice.
But switching between the current file and the TODO file is a real slow down which may make you skip writing "small ideas of the moment" that may eventually be important.
Even if suitable for some types of tasks (big features, global ideas, bug description...), it is not ideal for marking localized tasks.
==> So why not write ideas on the fly inside the sources, as a comment?
This method has many good characteristics:
* No friction, just write where you currently work.
* The note is written at the place where it applies.
* This is compatible with a global TODO list file for the global ideas, road map etc...
... and also raises some questions:
* How to collect these notes which are spread all over the source code?
* *"to rewrite"*, *"potential race condition"*, *"may be optimized easily"*, *"replace this number with a constant, instead"*, *"check with saturated input buffer"* ... these are not typical source code comments.
They do not explain the code but rather describe some future actions on it.
We need a way to differentiate these notes from standard code annotations.
==> For both raised questions, the choice of a text marker and a grep-like command should do the job.
**Here is the full proposal:**
* just write notes directly in the code and mark them with a discriminating text of your choice (ex: '@', '#', '@#', '@@', ...)
* still compatible with a "main TODO" file for the road map or global ideas
* search the full project for the marker and collect the notes
* Post-process them to refine the display (sorting, filtering, formatting...)
A simple `Python` implementation of this proposal is located in 'tools/todo.py'. It requires some parameters (files to parse and display choices) so shall probably be called either as a shell alias or as a Makefile target "todo".
The additional features are:
* extraction of the priority `P<n>` (P1 more urgent than P2 etc...). Items without priority are listed at the end
* extraction of the estimated workload `W<hours>`
* extraction of additional categories in brackets (ex: [BUG]), the main category being the one after the marker
* sorting on priority, filtering on priority and categories
!!!
The code of the tool is short, simple and commented, so easy to modify and adapt.
Usage is:
~~~~~~~~~~~~~~~~~~~~~~~~~~~~~~~~~~~ none
> ./tools/todo.py
This tool is a standalone part of Palanteer and used to manage generic todo lists.
The principle is simple:
- search inside all provided files for a marker (namely "@#" followed by the main category) and
collect text up to the end of the line.
- filter, reorder the list of the collected items and display them
An item can contain the following "attributes":
- P : priority (lower is more urgent. No priority means priority 99.)
- W : the workload in man-day
- [] : defines an additional category
Example of detected line: a = a+1; // @REWORK P2 W0.5 [EXAMPLE] [OPTIM] This part is suboptimal
Syntax: ./tools/todo.py [options] +
Options are:
Filtering:
-p keep only items within the priority range
-c keep only this category (may be used multiple times, with OR behavior)
-nc exclude any item containing this category (may be used multiple times, with OR behavior)
-sp sort per priority (default)
-sf sort per file, then priority
-sc sort per category, then priority. Duplicate items with multiple categories
Display:
-m monocolor (default: use ANSI color escape)
-f kind of display of the filenames (none, just the basename (default), or full path)
Try it! (fake todos are contained inside the tool file)
./tools/todo.py ./tools/todo.py
./tools/todo.py ./tools/todo.py -c OPTIM -c BUG
./tools/todo.py ./tools/todo.py -sc
./tools/todo.py ./tools/todo.py -p 0 1 -f none
~~~~~~~~~~~~~~~~~~~~~~~~~~~~~~~~~~~
As an example of usage, the todo.py tool contains these inactive lines, just for showcase:
~~~~~~~~~~~~~~~~~~~~~~~~~~~~~~~~~~~ none
"""
Base task for fixing a bug @#BUG [EXAMPLE] The behavior is not correct
Task with a priority @#OPTIM [EXAMPLE] P4 This for loop can be rewritten more efficiently
Task with a workload @#DOC [EXAMPLE] W1.5 Do not forget to update the doc for this new function doManyThings()
Task with additional categories @#OPTIM [EXAMPLE][URGENT] P3 We might consider optimizing this
Multiline task @#DOC There are many things to say about this task
// That is why several lines are required P4 [ROGNTUDJU] [EXAMPLE]
# What matters is the start column of the text compared to the marker (comment excluded)
Task with all @#OPTIM P5 [EXAMPLE] [REWORK] W0.5 [EASY] Tabulate the linearly interpolated cosinus values
"""
~~~~~~~~~~~~~~~~~~~~~~~~~~~~~~~~~~~
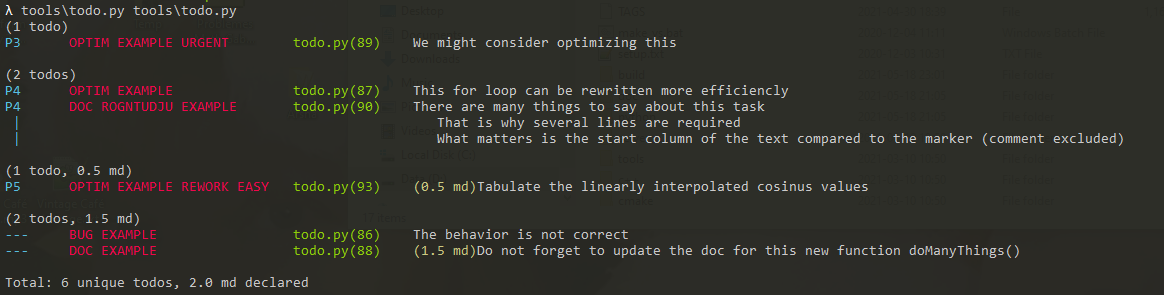
Applying the todo.py tool on itself gives:
!!!
During `Palanteer` development, the size of the todo list usually oscillated between 80 and 150 before really decreasing.
A todo list is as alive as the software it refers to...